

THE SHORT ANSWER
Original B2B research becomes useful when readers can see which question was investigated, who contributed and what conclusion the evidence actually supports. Start with a decision and a documented method, rather than a desired headline. This article addresses publishing your own surveys and observations. It differs from a research dossier that assembles existing sources: you are responsible for collection, analysis and bounded interpretation. A small, transparent investigation can be more useful than an apparently representative number with no defensible denominator, provided its limits remain visible wherever findings are reused.
To see how this step fits into your content strategy, read the pillar guide Content marketing for B2B SaaS: strategy, formats and qualified demand.
Write the research question before the headline
State the decision that the investigation could change. “How do administrators assess data handover before migration?” can be investigated; “Why is our category winning?” already embeds the desired answer. Separate descriptive questions from causal ones. A survey can report the obstacles participants name without proving which obstacle prevented a contract. Decide in advance which findings will be published and which assumptions are only exploratory. Product marketing owns the decision context, research reviews the question and sales contributes contrary cases. If the team would refuse an inconvenient result, agree an honest promotional brief before calling the exercise research. A useful protocol makes room for outcomes that do not support the campaign. Explore this further in the guide Measuring content: distinguish use, decision support and pipeline.
Distinguish recruitment from the population of interest
Define the people or organisations you intend to describe before sending invitations. Responses from your customer list are not a random sample of the entire market. Record recruitment channel, eligibility, field dates, language, exclusions and duplicate-participation handling. Decide whether the unit of analysis is a person, an account or a particular completed task.
Which population was actually reached?
Three employees at one customer must not silently become three independent companies. Report roles you failed to reach. More responses do not automatically repair systematic selection bias. A deliberately narrow sample may be appropriate for specialist users, provided the title and summary name that group rather than implying representation of all B2B buyers or the whole industry.
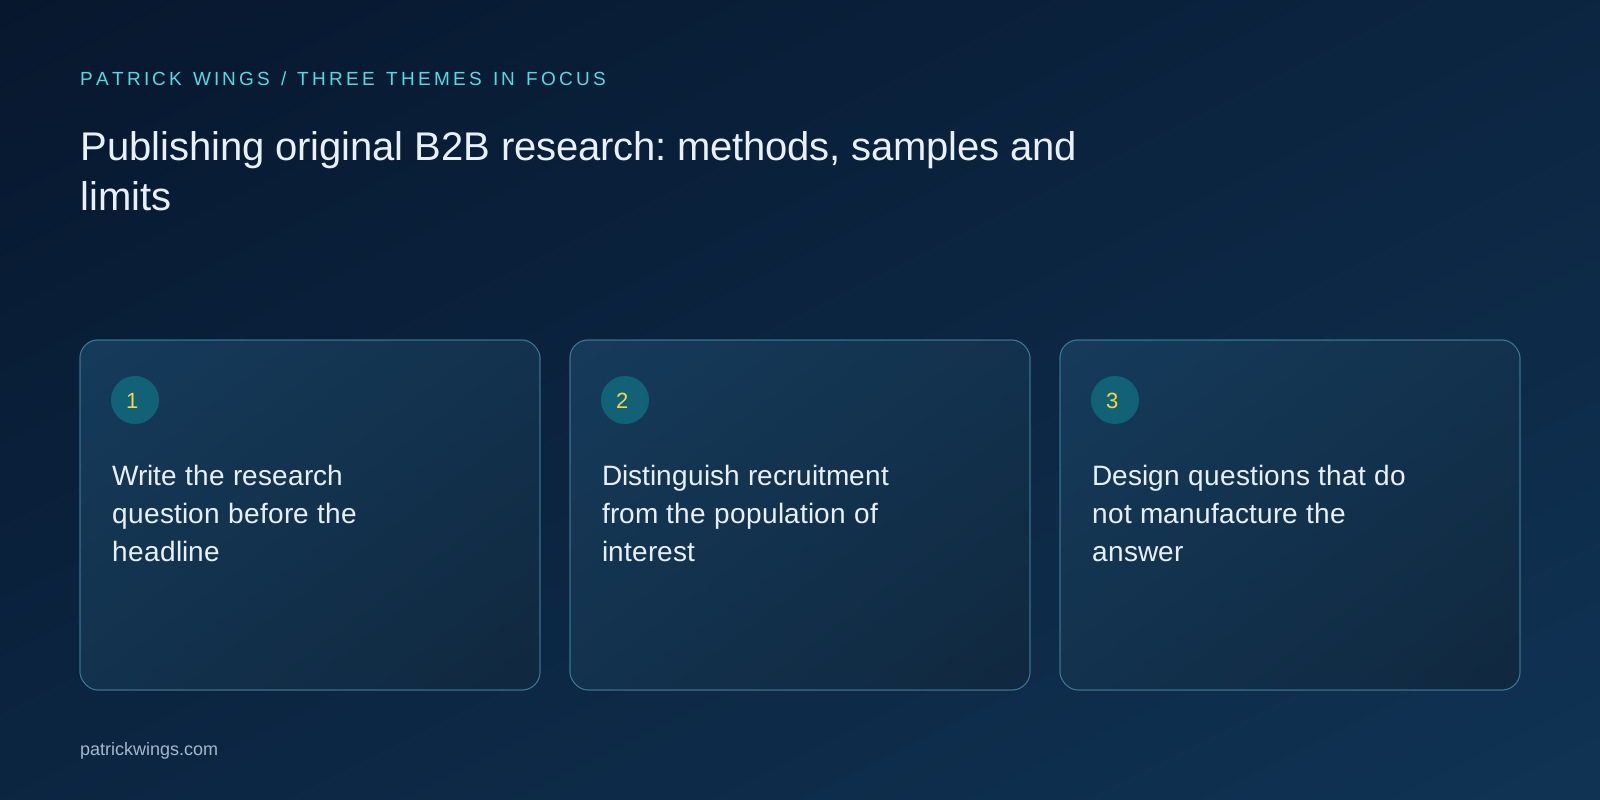
Design questions that do not manufacture the answer
Ask someone outside the campaign team to complete the questionnaire aloud. Check whether terms mean the same thing, time windows are clear and answer choices accommodate relevant counterexamples. Ask about a recent actual situation before collecting broad opinions. Split questions that combine different matters, such as initial configuration and daily operation. An option such as “not assessed” avoids forcing invented views. Preserve order and exact wording so future readers can assess instrument effects. Changes during fieldwork need a version identifier; do not automatically pool answers from different versions. A pilot checks comprehension. It does not establish representativeness, eliminate selection bias or prove that an apparent difference is statistically meaningful.
| Review field | Evidence or observation | Next decision |
|---|---|---|
| Question | Observation rather than assumed representation | Limit claim to the studied group |
| recruitment | Observation rather than assumed representation | Limit claim to the studied group |
| denominator | Observation rather than assumed representation | Limit claim to the studied group |
Separate observations, cleaning and interpretation
Keep permitted raw data separate from the cleaned working dataset. Where possible, define rules for incomplete responses, duplicates and quality problems before inspecting the results. Exclusions need reasons that apply regardless of whether the response supports the desired story. State the actual number of valid responses for each analysis. Different questions may have different denominators. For open responses, develop a coding guide with examples and borderline cases, and have another person review disputed assignments. Report unknowns and uncollected information explicitly. Do not present a sampling margin of error for a self-selected sample as though it were a simple random sample. Bring appropriately qualified specialists into sensitive, legal or technically complex research decisions.

Publish a methods statement that permits scrutiny
The methods statement belongs in the accessible online edition and the downloadable document. Name the sponsor, research team, question, target population, recruitment route, field dates, response counts, question wording and material processing steps. AAPOR provides disclosure standards for research reporting; following a useful checklist does not mean your study has been independently certified. Place limitations beside important findings, not only in fine print. Distinguish human responses from simulated or AI-generated data. Synthetic answers are not interviewed buyers. If you cannot release the dataset, explain why and provide sufficient methodological detail. Confidentiality cannot justify an unsupported market-wide claim; sometimes the public conclusion must become narrower than the internal interpretation.
Fictional example: tell a narrow finding accurately
This scenario is explicitly fictional. SaaS provider Northpath surveys 24 administrators from invited existing customers about their most recently completed import. In this invented example, nine report manual rework. The defensible statement is that nine of the 24 responding administrators reported that experience.
What claim does the fictional case support?
It does not establish that 37.5 percent of all businesses face the issue or that Northpath removes it. The team publishes the exact question, recruitment route and limitations, then conducts follow-up interviews about the actual tasks. Its content explains what rework meant and which product questions remain unresolved. These figures illustrate reporting logic only: they are not real customer results, a representative estimate or an industry benchmark.
Package findings as bounded, citable statements
For each important finding, assemble the claim, population, period, denominator, source and limitation. That package should remain understandable when a graphic travels outside the full report. A figure missing these elements must not become a standalone social card. Explain abbreviations and units, describe tables in ordinary prose and provide meaningful image alternatives. Search and answer systems do not need invented optimisation formulas; clear statements with verifiable context support readers and reuse. They do not guarantee rankings or citations. Give sellers an approved short version and examples of prohibited overstatement. A useful sentence identifies the responding roles rather than referring vaguely to “decision makers” as though every relevant buyer were represented. Explore this further in the guide Publishing customer examples: document permission and scope.
Treat correction as part of publication
Before release, research reviews methods, a subject expert reviews interpretation and an editor checks every headline for overgeneralisation. Recalculate figures and compare each graphic with the current dataset. Assign a contact for questions and show a version date. If an error emerges, do not silently change only one table: review the PDF, online edition, presentations and approved sales excerpts. Record which statement changed and why. Plan the next study around an unresolved question rather than the desire for a larger percentage. Pause promotion when a material recruitment or calculation error undermines the central conclusion. Additional distribution cannot make an unsupported statement reliable, and a visible correction can be more useful than defending an attractive but invalid headline.
INTERACTIVE / FROM READING TO ACTION
Three checkpoints for your implementation
Choose a checkpoint and track your reading progress. Checks are neither saved nor sent and do not score your business.
CHECKPOINT 01
Design questions that do not manufacture the answer
Ask someone outside the campaign team to complete the questionnaire aloud.
Explore in the article ↗CHECKPOINT 02
Separate observations, cleaning and interpretation
Keep permitted raw data separate from the cleaned working dataset.
Explore in the article ↗CHECKPOINT 03
Publish a methods statement that permits scrutiny
The methods statement belongs in the accessible online edition and the downloadable document.
Explore in the article ↗Frequently asked questions
How large must a B2B sample be?
That depends on the question, sampling method and intended inference. A large self-selected response count is not automatically representative. Plan the analysis with a qualified researcher and describe the group actually reached.
Can customer responses be presented as a market study?
The defensible description names the population reached. A study of your own customers should say so, without a headline suggesting coverage of every potential buyer or the entire category.
What should we do with inconvenient findings?
Check collection and calculations using the same rules applied to favourable findings. Do not change exclusions to manufacture a positive story. Revise the editorial conclusion when the evidence requires it.
Can AI-generated answers be added as respondents?
Do not represent generated answers as human participation. Keep synthetic exploration separate from collected evidence and clearly disclose methods and limitations in every public interpretation.
Must the full raw dataset be public?
Not necessarily; confidentiality and permitted use may constrain release. Still disclose enough methodological detail and make only conclusions readers can assess within those stated limits.
Which metric demonstrates content success?
Observe whether relevant readers understand findings, consult methods and ask useful questions. Downloads alone demonstrate neither research quality nor a causal contribution to subsequent revenue.