

THE SHORT ANSWER
Retention cohorts show how comparable groups continue using a product or remain customers over time. They can reveal changes hidden by an overall metric. Cohort entry, return and observation windows must be defined clearly. The curve provides directions for investigation rather than an automatic explanation of causes, and its usefulness depends on the business question it is meant to support.
To connect this decision with positioning, market entry and growth, read the pillar guide Go-to-market for B2B SaaS: turn market insight into an executable growth strategy.
Choose the actual retention question
Clarify whether you are examining usage, active accounts or contractual retention. These are not interchangeable. An organisation can keep paying while barely using the service; a team can use it intensely while renewal remains uncertain. Describe the decision the analysis should inform. An onboarding problem needs different groups from evaluation of a new package structure. Choose the appropriate level as well. Where value depends on collaboration, account cohorts may be more meaningful than individual users. Document the choice before comparing curves so colleagues know which form of continued engagement the analysis actually represents. Explore this further in the guide Define activation around first value.
Define entry and return precisely
Specify the starting event and the later activity representing meaningful return. Amplitude documents this distinction and different time calculations. Select a method matching the natural usage rhythm. A monthly planning process should not automatically be assessed through daily return. Define timezone, intervals and exceptions. Test events, internal accounts and incorrect identity mapping can distort results. Make exclusions traceable. The technical availability of a default view is not a sufficient reason to adopt its definition as a business metric. Check what the chart counts before discussing why a particular percentage is rising or falling.
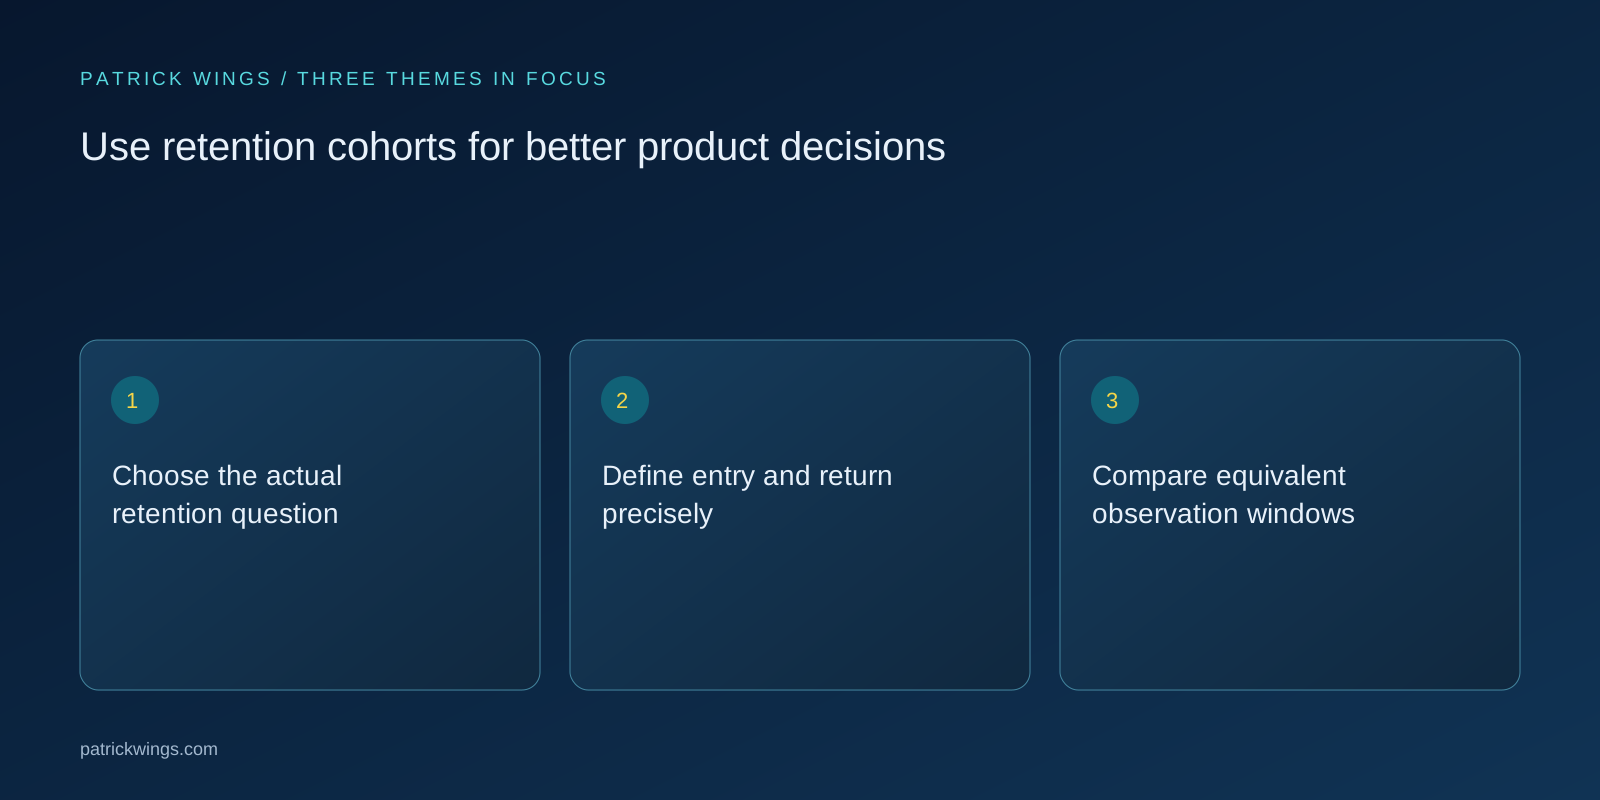
Compare equivalent observation windows
Newer cohorts have not had the same opportunity to return as older ones. Identify incomplete windows and compare equivalent relative periods. Check group size and changes in composition. Apparent improvement might reflect a channel attracting different customers or a segment becoming less represented. Split the analysis only as far as the question and data justify. Very small subgroups readily produce random differences. Show absolute counts alongside proportions and keep uncertainty visible. Avoid interpreting every movement as a product effect when the underlying population or time available for observation has changed in a material way.
Hypothetical example: a revised entry experience
A fictional supplier introduces revised setup. Accounts starting afterwards initially return to planning more often. The team discovers that the later cohort mostly consists of established contacts, while earlier starts came from a broad acquisition channel. It compares suitable subgroups and investigates entry through conversations. Interpretation remains provisional while observation windows and composition differ. The example reports no measured success values. It demonstrates why proximity to a product change does not establish that the change caused stronger retention, even if the narrative is attractive and the chart appears to move in the desired direction.

Explain curves through concrete histories
Select cases from different paths for closer investigation. What happened before return stopped? Was the task finished, did it disappear or was work blocked? Add support evidence and conversations. Longer inactivity can be normal for an infrequently used product and problematic for a recurring operational task. Avoid assigning one cause to everybody within the same curve. Cohorts help locate interesting differences. Connecting them with work context and further evidence creates a plausible explanation and an appropriate direction for product or service changes. Without that connection, the same chart can support several contradictory stories. Explore this further in the guide Learn from churn without treating every statement as a cause.
Turn analysis into testable decisions
Choose a bounded hypothesis and next step. A segment may need different preparation, a channel may produce unsuitable starts or a feature may be difficult to find. Define the expected observation after a change and the side effects that need checking. Keep definitions consistent over time or mark version changes. Sound cohort work combines technical care with business interpretation. Creating more groups does not automatically improve it. Value comes from connecting an understandable question, dependable data and an owned decision whose limitations the team recognises rather than concealing uncertainty behind increasingly detailed dashboards.
INTERACTIVE / FROM READING TO ACTION
Three checkpoints for your implementation
Choose a checkpoint and track your reading progress. Checks are neither saved nor sent and do not score your business.
CHECKPOINT 01
Compare equivalent observation windows
Newer cohorts have not had the same opportunity to return as older ones.
Explore in the article ↗CHECKPOINT 02
Hypothetical example: a revised entry experience
A fictional supplier introduces revised setup.
Explore in the article ↗CHECKPOINT 03
Explain curves through concrete histories
Select cases from different paths for closer investigation.
Explore in the article ↗Frequently asked questions
Are paying customers automatically active users?
No. Contractual retention and product usage answer different questions.
Why might newer cohorts look better?
Composition or incomplete observation may differ. Check both before claiming an effect.
Which return activity counts?
Use a meaningful action matching the task’s natural rhythm, rather than automatically counting any login.
How can I put “Choose the actual retention question” into practice?
Clarify whether you are examining usage, active accounts or contractual retention. These are not interchangeable. An organisation can keep paying while barely using the service; a team can use it intensely while renewal remains uncertain.
What matters when working on “Define entry and return precisely”?
Specify the starting event and the later activity representing meaningful return. Amplitude documents this distinction and different time calculations. Select a method matching the natural usage rhythm.