
THE SHORT ANSWER
AI monitoring should detect when work stops functioning as intended, both professionally and technically. Combine output quality, handoffs, tool states and effort rather than simply counting requests. Assign an accountable person and a possible response to each meaningful signal. A dashboard can provide visibility, but dependable operation requires a decision and response connected to what it shows about the actual work.
To connect individual AI applications with reliable marketing operations, read the pillar guide AI transformation in B2B marketing: from individual prompts to reliable operations.
Start with observable operational problems
Describe important undesirable conditions: unsupported claims, incorrect record changes, excessive waiting, ambiguous execution and blocked approvals. Connect each condition to a detectable signal. Not every professional weakness can be fully measured automatically, so combine technical events with targeted human sampling. A successful HTTP request may contain an unusable answer. Conversely, deliberately stopping a task may be correct behaviour. Define these distinctions before calculating an error rate. Otherwise monitoring can penalise the very questions and stops you intentionally designed as appropriate responses to missing information, uncertain identity or inadequate authorisation for a consequential operation.
Connect signals to a work unit
Use a shared work identifier linking intake, tool requests, approvals and results. Capture relevant version information so a new problem can be connected to a configuration change. Store only necessary content and consider access controls on operational records. Complete customer text does not automatically belong in every monitoring view. Structured states and references to controlled sources may suffice. Professional investigation still needs access to appropriate evidence, so define who can open detailed cases and which information is retained under the organisation’s operational rules. This makes monitoring useful without indiscriminately duplicating sensitive material. Explore this further in the guide CRM data quality for trustworthy marketing decisions.
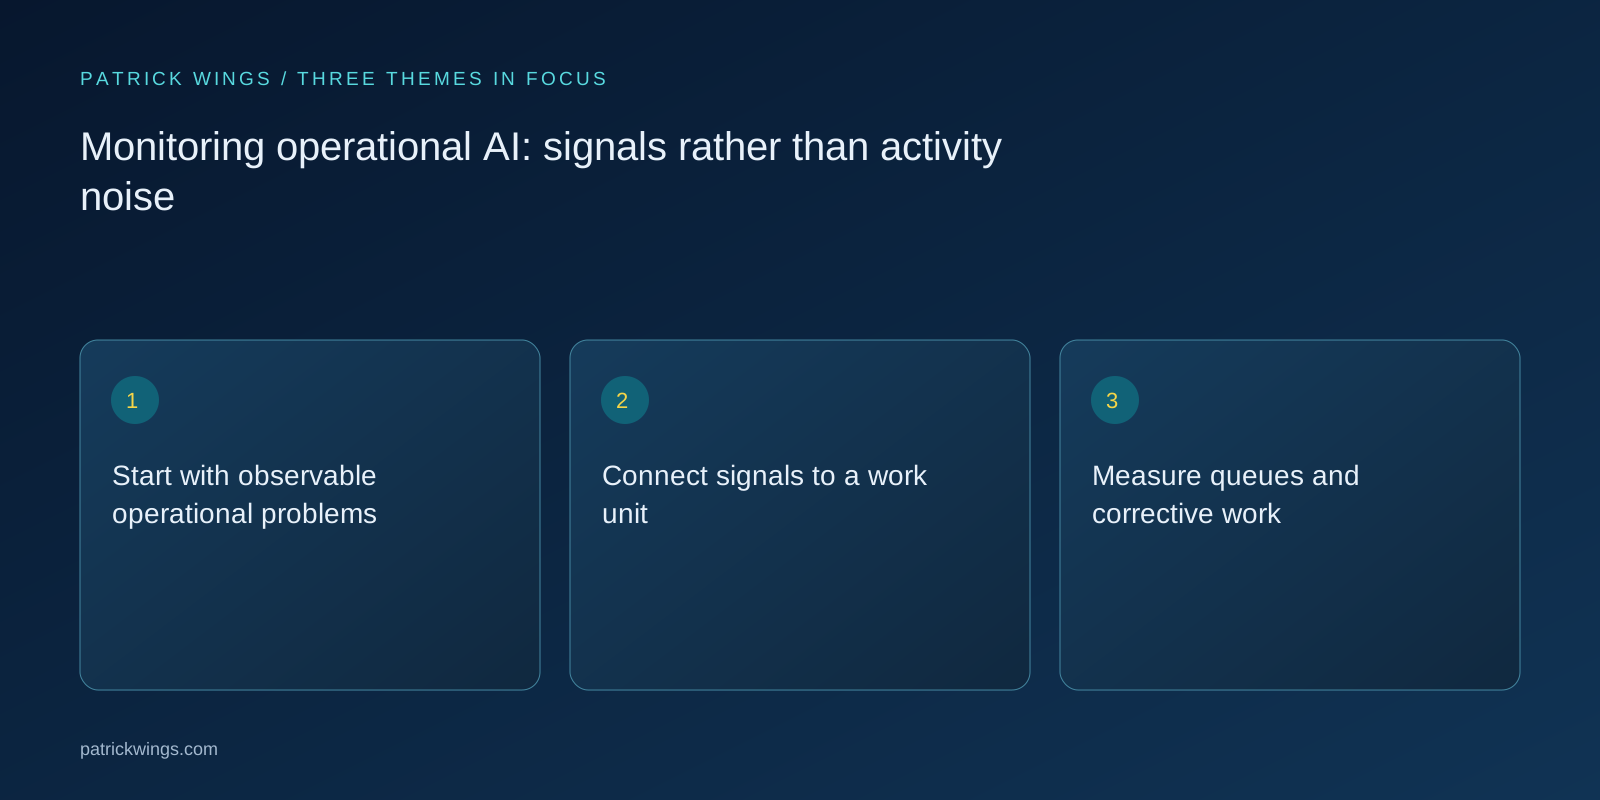
Measure queues and corrective work
A low technical error rate can conceal a stalled process. Track unresolved questions, the age of pending approvals and repeated returns from receivers. Separate system processing time from waiting on professional decisions. Also record whether a person regularly has to recreate results entirely. Such rework may reveal quality deterioration before a visible outage occurs. Interpret signals against workload and case mix. More difficult requests can explain increased escalation without any decline in the workflow or new model defect. Keep the denominator and definition stable enough that a change in volume is not mistaken for changed reliability.
Design alerts around actionability
An alert should explain the affected work area, available evidence and what the owner can inspect. Group related events rather than generating a new message for each repeated tool failure. Distinguish urgent incidents from issues suitable for the next operational review. Define when an automatic pause is appropriate and which conditions require investigation. Revisit alerts nobody can act on. Ownership may be missing or the signal may be poorly chosen. An ever-growing warning list cannot replace response paths and sensible prioritisation. Record whether the action taken resolved the affected work rather than merely closing the alert. Explore this further in the guide When an AI workflow fails: a practical incident response.

Trace a fictional rise in unresolved cases
A fictional knowledge agent begins asking more clarification questions about product availability. The model and search service remain technically available. Case inspection shows that a new regional product list was never added to the approved source collection. The team updates the source and reviews affected answers. This hypothetical example shows why availability monitoring alone would miss the issue. Question counts alone do not prove a model defect either. Connecting the signal with work samples and source versions enables a reasoned diagnosis and directs corrective work toward the missing foundation rather than an unrelated model change.
Test monitoring and response together
Generate controlled events for missing sources, a tool outage and a stalled approval. Check that the right signal reaches the accountable person with enough context. Have that person perform the intended next step and then inspect work state. Update limits and sampling as the work domain changes. Regularly examine important failures discovered outside monitoring. Those gaps indicate observations that may need adding. A green dashboard means its existing checks found nothing; it does not establish that unmonitored failure types are absent. Keep this distinction visible when using operational reports to support wider deployment or reduced human review.
INTERACTIVE / FROM READING TO ACTION
Three checkpoints for your implementation
Choose a checkpoint and track your reading progress. Checks are neither saved nor sent and do not score your business.
CHECKPOINT 01
Measure queues and corrective work
A low technical error rate can conceal a stalled process.
Explore in the article ↗CHECKPOINT 02
Design alerts around actionability
An alert should explain the affected work area, available evidence and what the owner can inspect.
Explore in the article ↗CHECKPOINT 03
Trace a fictional rise in unresolved cases
A fictional knowledge agent begins asking more clarification questions about product availability.
Explore in the article ↗Frequently asked questions
Which metric matters most?
It depends on the task and consequences. Combine professional quality, handoffs and technical state rather than seeking one universal metric.
Are clarification questions always a bad signal?
No. They may be correct responses to missing information. Inspect causes and case mix.
How can we avoid alert fatigue?
Connect alerts to actionable decisions, group related events and remove signals without a useful response path.
How can I put “Start with observable operational problems” into practice?
Describe important undesirable conditions: unsupported claims, incorrect record changes, excessive waiting, ambiguous execution and blocked approvals. Connect each condition to a detectable signal. Not every professional weakness can be fully measured automatically, so combine technical events with targeted human sampling.
What matters when working on “Connect signals to a work unit”?
Use a shared work identifier linking intake, tool requests, approvals and results. Capture relevant version information so a new problem can be connected to a configuration change. Store only necessary content and consider access controls on operational records.