

THE SHORT ANSWER
Diagnose ad fatigue after checking audience, offer and measurement.
For the broader picture of how target customers, channels and sales handoffs work together, read the pillar guide B2B demand generation: from attention to qualified pipeline.
Diagnose fatigue first
Diagnose ad fatigue after checking audience, offer and measurement. Falling click or conversion rates can reflect repetition, but also a market shift, technical issues or a different mix of people reached. New artwork alone does not resolve those alternative causes of declining reported performance.
State which metric declined, when it started and which buyer task is affected. Weaker clicks with stable suitable conversations call for a different response from falling qualified demand. Without that distinction, every visible fluctuation can become an unnecessary creative emergency.
Connect delivery and changes over time
Build a timeline covering creative launch, spend, reach, repetition, offer and major account changes. Separate newly reached people from repeated exposure where the data permits. Include changes to forms and CRM qualification that may themselves create an apparent performance decline without any change in message reception.
Add changes in sales capacity, form function and qualification rules. A failed CRM feedback process can resemble declining advertising performance. The timeline therefore connects delivery with downstream systems that confirm quality rather than serving merely as a design archive.
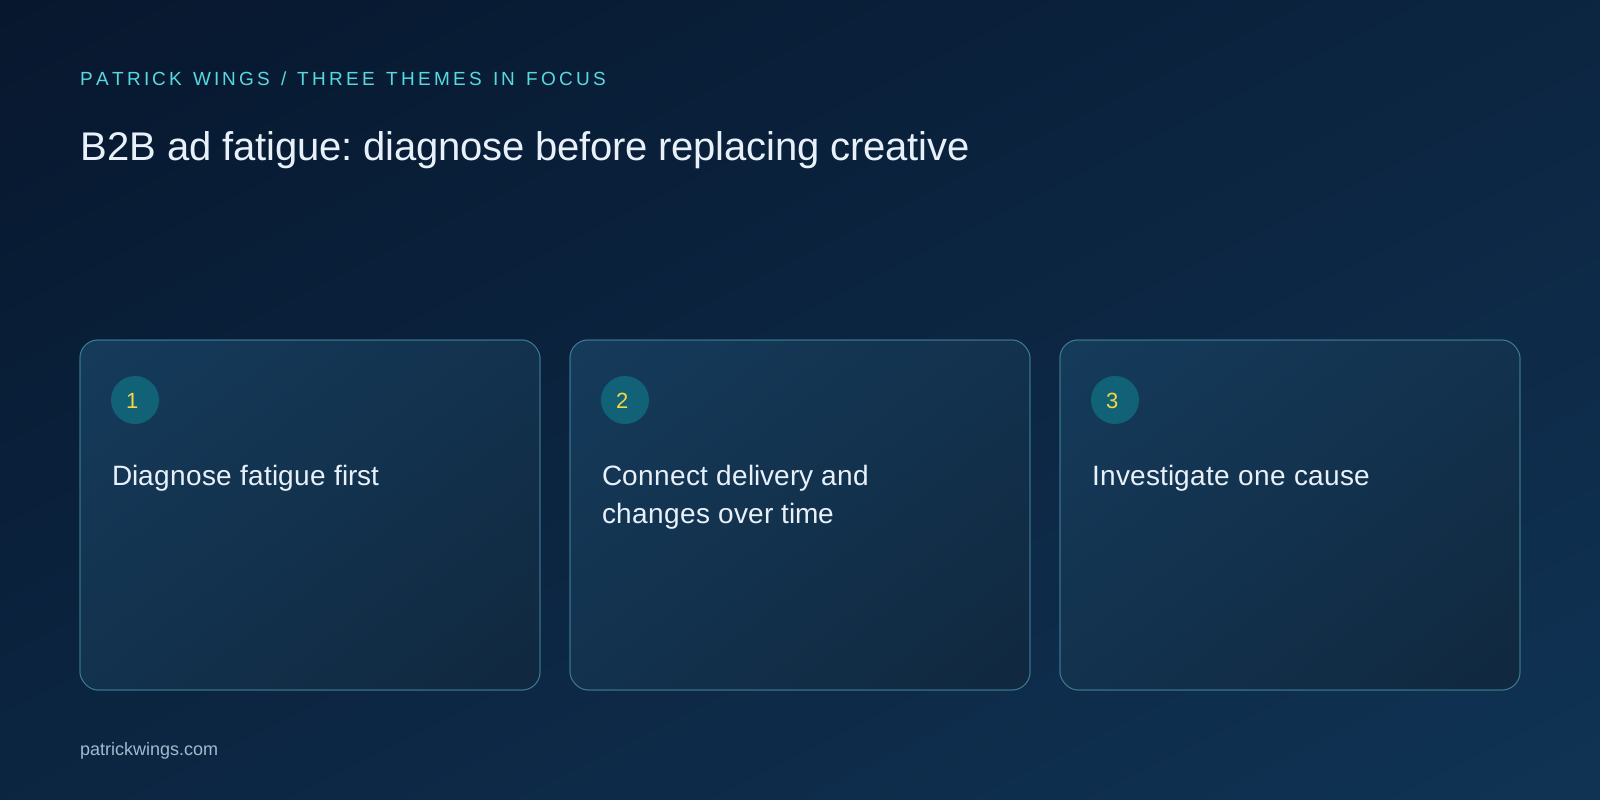
Investigate one cause
Check the destination and tracking first. Then compare similar delivery periods and inspect whether one segment changed the aggregate result. Test a new kind of evidence or a different objection within a bounded area. Avoid replacing targeting, offer and visual treatment at the same time. Explore this further in the guide B2B paid media experiments with clear decision rules.
Use a practical sequence: tracking works, destination works, audience is comparable, message remains relevant. Test a creative alternative after those checks. This avoids production work when a broken form or accidentally excluded market is responsible for the reported decline.
Why the CTR comparison is insufficient
A hypothetical team sees click-through rate fall from 1.2 to 0.8 percent. During the same period it doubles spend and expands targeting. A new creative lifts the rate to 0.9 percent. That sequence cannot establish a clear fatigue diagnosis because reach and audience composition had already changed substantially.
The team should examine original and expanded audiences separately where the design permits. If the old group remains stable while expansion lowers the average, audience selection is a stronger explanation than a suddenly exhausted message affecting everyone previously reached.

Averages and selection effects
High repetition need not be distributed equally. Averages hide that distribution, and a new advert may initially look stronger because delivery changes. Seasonality and competition also affect outcomes. Do not mistake performance following a creative replacement for unambiguous evidence that the replacement caused the improvement. Explore this further in the guide Campaign retrospectives: turn results into testable changes.
A new variant may initially receive different placements or people. Watch those delivery conditions. Comparing a new advert’s first week with an old advert’s full lifetime mixes novelty, period and audience; it is not an isolated test of visual treatment.
Clicks versus conversation quality
Assess whether relevant reach, suitable conversations and objection resolution improve together. If only clicks increase while conversation quality declines, the new creative may attract more attention while communicating less precisely. Record the trade-off explicitly rather than reporting the attention metric as complete campaign recovery.
Alongside clicks, record whether the message creates suitable expectations. More enquiries for services you do not provide are a warning. A more precise advert may attract fewer curious clicks while improving commercial fit, so review both attention and subsequent suitability together.
Let diagnosis guide production
Maintain a creative log with message, evidence, audience and change date. Let the diagnosis guide the next production brief: a different objection, stronger proof or a new presentation. A fixed replacement calendar should not substitute for understanding what changed in the buyer task or delivery conditions.
The production brief names the suspected cause and intended counterevidence. Add verifiable proof when trust is missing, or change content when the task has changed. This creates a reasoned creative pipeline rather than a rotation schedule whose learning value cannot be explained.
INTERACTIVE / FROM READING TO ACTION
Three checkpoints for your implementation
Choose a checkpoint and track your reading progress. Checks are neither saved nor sent and do not score your business.
CHECKPOINT 01
Investigate one cause
Check the destination and tracking first.
Explore in the article ↗CHECKPOINT 02
Why the CTR comparison is insufficient
A hypothetical team sees click-through rate fall from 1.2 to 0.8 percent.
Explore in the article ↗CHECKPOINT 03
Averages and selection effects
High repetition need not be distributed equally.
Explore in the article ↗Frequently asked questions
Is there a universal frequency limit?
No. Task, audience, period and message shape the interpretation.
Does falling CTR establish fatigue?
No. A falling click-through rate may also reflect changes in audience, offer or measurement. Check those conditions before treating creative replacement as the solution.
What should change first?
The evidenced cause, rather than every creative element at once.
How can I put “Diagnose fatigue first” into practice?
Diagnose ad fatigue after checking audience, offer and measurement. Falling click or conversion rates can reflect repetition, but also a market shift, technical issues or a different mix of people reached. New artwork alone does not resolve those alternative causes of declining reported performance.
What matters when working on “Connect delivery and changes over time”?
Build a timeline covering creative launch, spend, reach, repetition, offer and major account changes. Separate newly reached people from repeated exposure where the data permits. Include changes to forms and CRM qualification that may themselves create an apparent performance decline without any change in message reception.